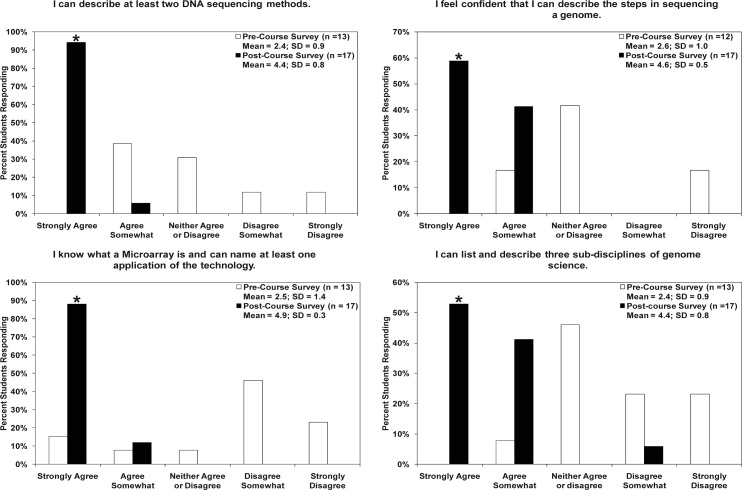
FIG. 2.
For all four statements, students demonstrated a significant increase in genomics knowledge and skills in the postcourse survey results versus the precourse survey. The precourse survey mean scores were significantly lower than the postcourse survey mean scores in all four categories (P <0.005) according to Student’s t test, two-sided analysis. The postcourse survey bar denoting the percentage of students who indicated that they “strongly agreed” with the above statements is significantly higher than the precourse results. In all four graphs, the P value is less than 0.003 according to Fisher’s exact test, two-sided analysis (denoted with an asterisk).

