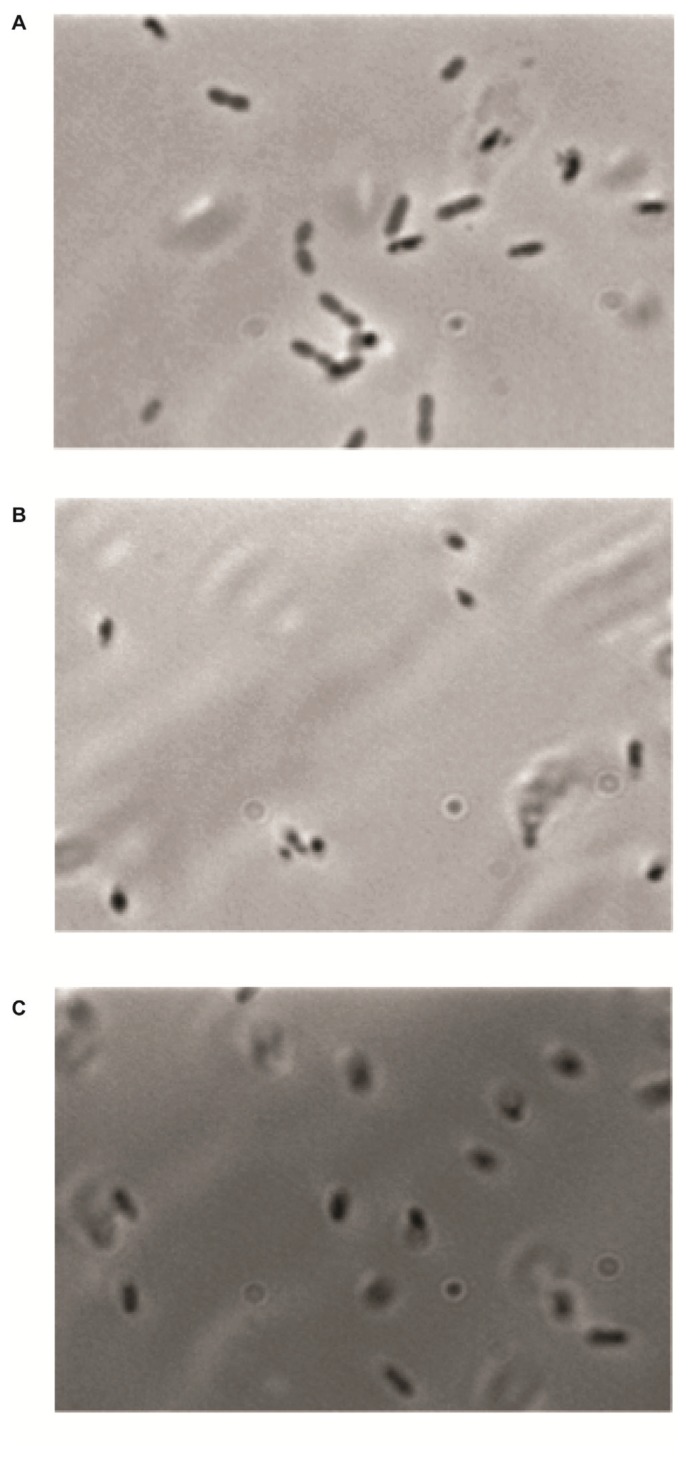
FIGURE 3.
Microscopic analysis of cells collected from different gradient layers and synchronized pellets: (A) cells with majority of dividing cells were collected from 68% density layers; (B) cells with evenly mixed cell populations were taken from 69% layers; (C) cells were collected from bottom pellets with highest buoyant densities. Note: Most cells were newborn.

