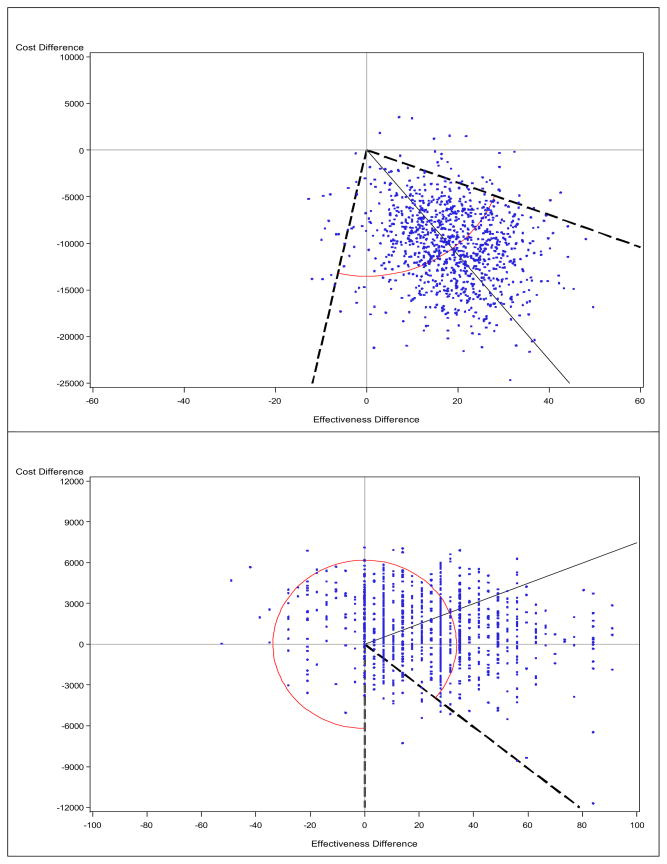
Figure 1. Cost-effectiveness plane using the mean (upper) vs. the median (lower): Schizophrenia study.
The solid line indicates the point estimate, and the broken line indicates a 95% confidence interval for the ICER (connected by arc), obtained from the bootstrap-wedge method. Note that the scale is different on the y-axis.

