
Figure 5.
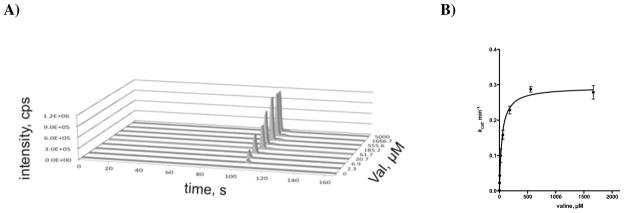
A) LC–MS data for production of aureusimine-A (1) at varying concentrations of L-Val. B) Normalized plot of the data shown in panel A used to determine the steady-state kinetic parameters of AusA with L-Val. Each reaction contained 40 nM holo–AusA, 375 mM Bicine pH 8.0, 10 mM MgCl2, 3 mM ATP, 0.1 mM NADPH, 1 mM TCEP, 1 mM L-Tyr and 2.3 μM–5 mM L-Val.