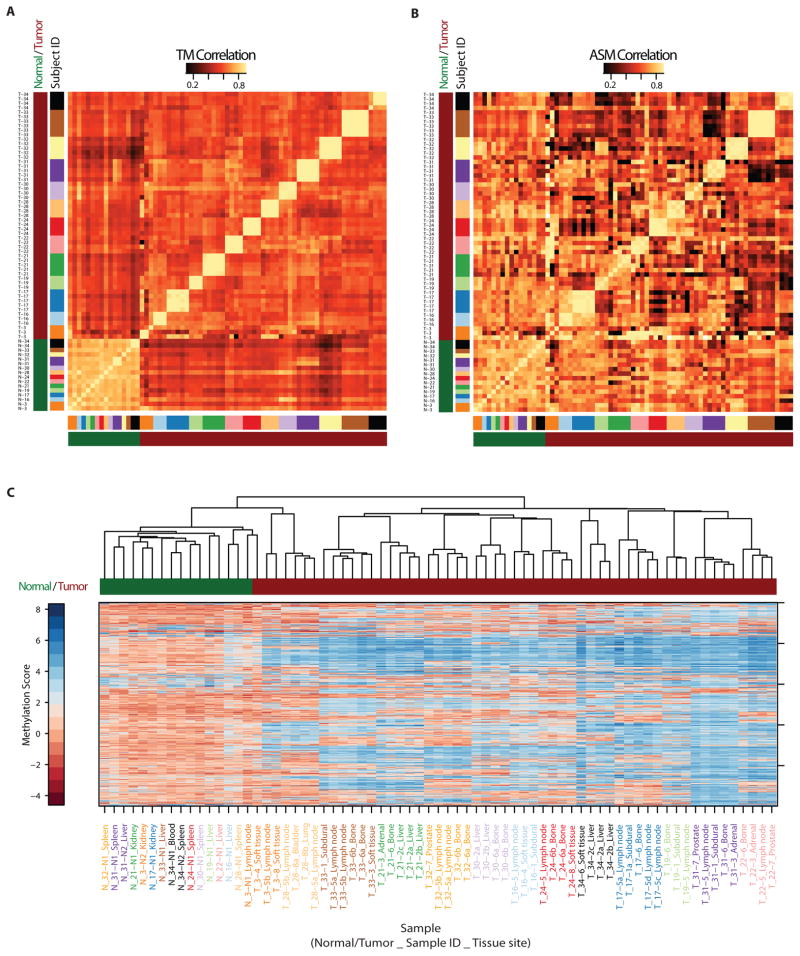
Figure 2. DNA methylation alterations are heterogeneous across individuals, but closely maintained in the metastases within each individual.
Between-sample correlation for (A) total DNA methylation (TM), and (B) allele-specific DNA methylation (ASM). Axis labels indicate tissue type (tumor vs. normal) and subject identifier. The light colored block diagonal structure shows high inter-individual correlation for normal tissues (bottom left) and high intra-individual correlation and inter-individual heterogeneity for metastases. (C) DNA methylation hierarchical clustering showing high within-subject similarity and between-subject heterogeneity of metastases. These analyses were done using the 500 probes showing greatest variability across all samples.

