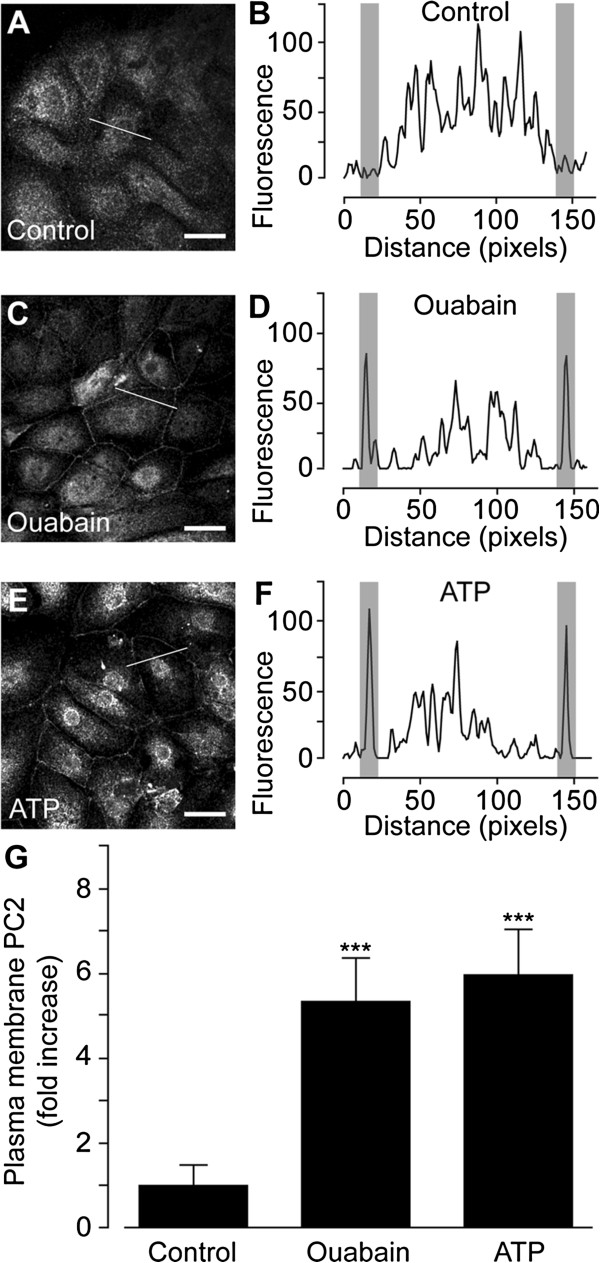
Figure 1.
PC2 trafficking to the PM in human proximal tubule (hPT) cells. (A-F). Immunocytochemistry of PC2 in hRT cells treated with control (A), 1 μM ouabain (C), or 25 μM ATP (E). Scale bars, 20 μm. Localization profile of PC2 along a line (as indicated) through the center of a single hPT cell treated with control (B), ouabain (D), or ATP (F). Gray areas represent PM regions. (G) Quantitative analysis of a number of PM PC2-positive hRT cells following indicated treatments. Values are the mean ± SEM, and ***P < 0.001 vs. control.

