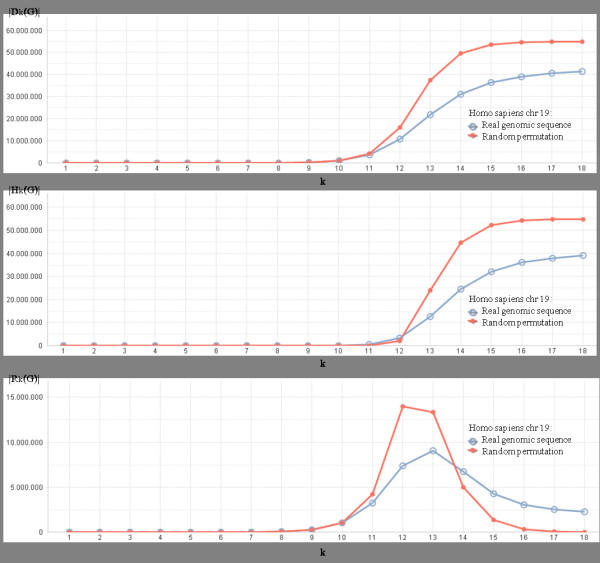
Figure 6.

Cardinality trends of|Dk(G)|(chart on top),|Hk(G)|(second chart), and|Rk(G)| (bottom chart), for G being theHomo sapiens (chromosome 19), and fork = 1,…,18. Blue lines (big dots) represent dictionary trends of real genomic sequence, and red lines (small dots) represent dictionary trends for a random permutation of the same genomic sequence. First chart: number of genomic k-words; Second chart: number of hapax k-words; Third chart: number of repeat k-words.
