
Figure 6.
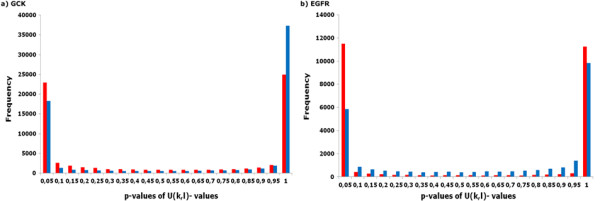
Four p-value distributions of (transformed) normalized mutual information values for human GCK and EFGR proteins having PDB-ID 1V4S and 2J6M, respectively. The bar charts illustrate the two steps of our model: i) blue bars show the p-value distribution of the -scores; ii) red bars display the p-value distribution of the -values. The p-values close to zero represent the significant pairs by means of which we assess the individual residue position. As one can see, within [0.25,0.70] these four distributions are approximately uniform.