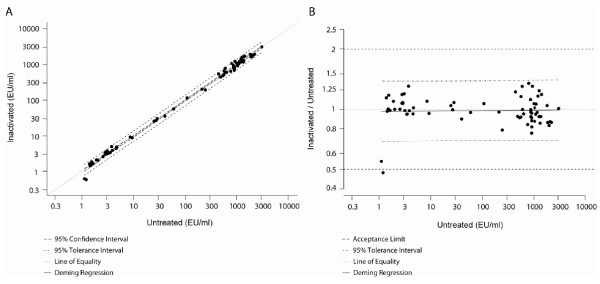
Figure 2.

Comparison of heat inactivated samples with non-inactivated samples. A, Deming regression (ultrastructural model) of non-inactivated serum (untreated‘) as a function of inactivated serum samples (inactivated) where variances are considered as equal. B, Plot of the bias - Deming regression represented with ratios (inactivated/untreated) versus inactivated (ultrastructural model) where variances are considered as equal.
