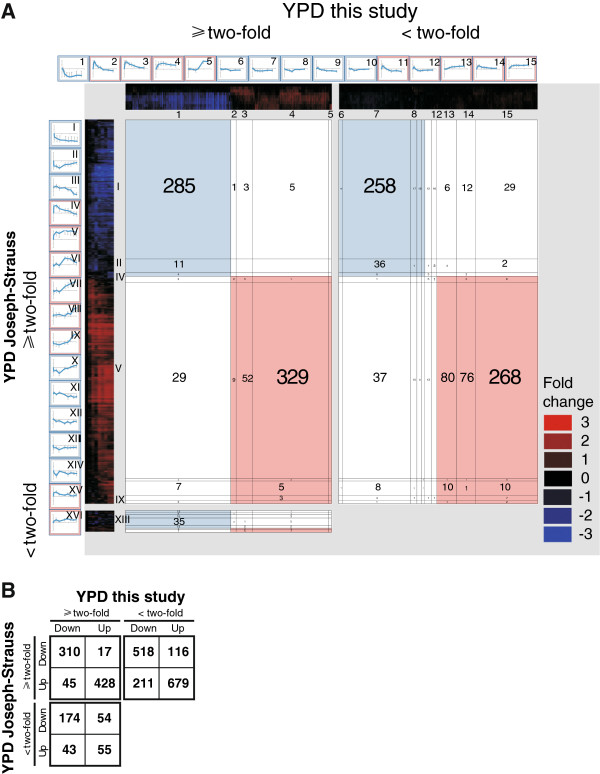
Figure 5.
Comparison to a previous study confirms a core germination program and pinpoints novel regulated gene groups during germination onset. (A) Two-dimensional hierarchical clustering of the germination program observed here (x-axis) and reported previously (y-axis); both in YPD [11]. As in Figure 3, three plots are separated by grey fields; genes two-fold changed in both data sets to the upper left, genes two-fold changed in the Joseph-Strauss dataset but not in our data to the upper right, genes two-fold changed in our data but not in the Joseph-Strauss dataset to the lower left. Each cluster is subdivided into groups of genes with correlation factors ≥0.75 by thin black lines and the average expression profiles of groups of ≥ ten genes are framing the plots. The colour panels along each axis indicates diminished expression of genes (blue) and stimulated genes (red), compared to dormant spores. Each gene occurs once on each axis and the number of genes (belonging to a cluster group of ≥10 genes with correlation factor ≥0.75) intersecting in each square is displayed. The graphs with average expression profiles are indexed with arabic and roman numerals for the groups in our data and the Joseph-Strauss data, respectively. The complete two dimensional hierarchical clustering with all genes included is depicted in Additional file 4. (B) Numerical representation including all 2650 genes in the analysis.

