Figure 6.
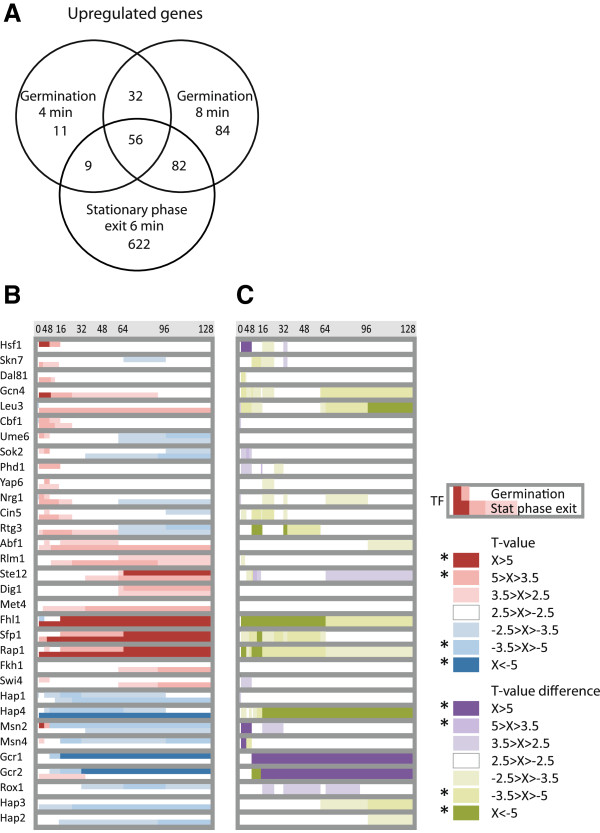
The gene expression program during germination and stationary phase exit largely overlap. (A) Venn diagram visualizing the overlap of genes ≥ two-fold upregulated within the first minutes after addition of rich growth medium (YPD) to stationary phase cells [24] and spores (germination in YPD; this study). These time points show the overlap of upregulated genes during the first minutes upon dormancy exit. (B) T-profiler analysis of the first two hours of YPD-induced dormancy exit displayed as T-scores for each TF during germination (upper line) and stationary phase exit (lower line), and as (C) differential display showing the difference in T-score when either germination (purple) or stationary phase exit (green) is stronger. The two gene expression programs largely overlap (all white fields) but show some distinct characteristics.

