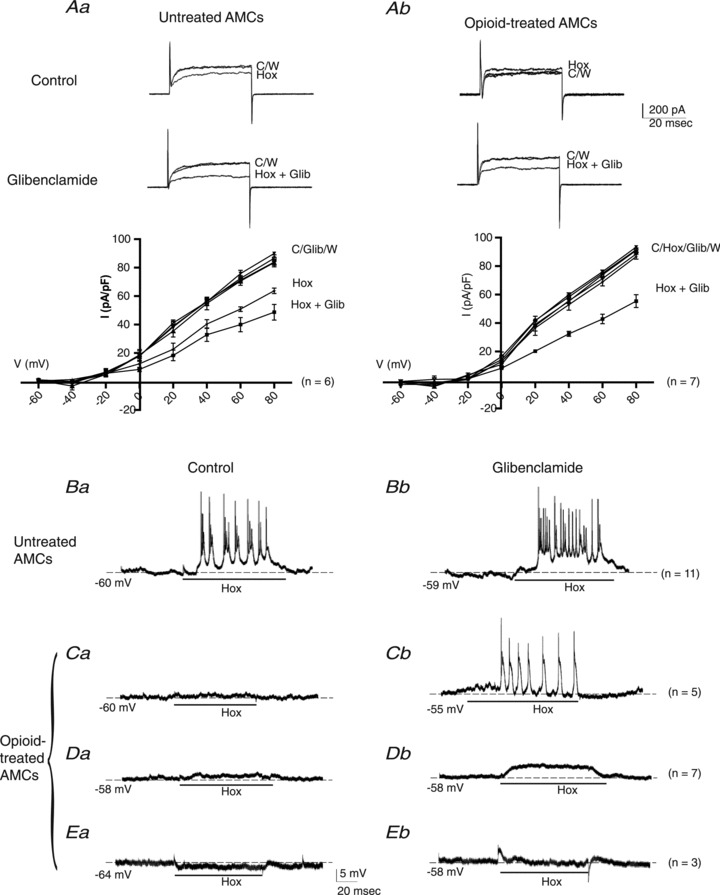
Figure 2. Effects of glibenclamide on outward K+ current and membrane potential during hypoxia in control vs. opioid-treated neonatal AMCs.

In control (untreated) AMCs, glibenclamide (50 μm) enhances the hypoxia-induced inhibition of outward K+ current as shown in upper sample traces (steps to + 30 mV) and lower current density vs. voltage (I–V) plot (Aa); significant difference (P < 0.05) between current density in hypoxia (Hox) and hypoxia plus glibenclamide (Hox + Glib) at potentials ≥+30 mV. By contrast, opioid-treated cells failed to respond to hypoxia alone, but when combined with glibenclamide, there was a pronounced inhibition of outward current at positive potentials (> +20 mV), as shown in upper traces and lower I–V plot (Ab). Data are presented as mean ± SEM. (P < 0.05). Under current clamp, the hypoxia-induced membrane depolarization and increased excitability (Ba) was potentiated when glibenclamide was applied to the same control cell (Bb) (n= 11). By contrast, membrane depolarization was absent or weak when hypoxia was applied to opioid-treated cells (Ca, Da), and even a weak hyperpolarization occurred in a few cases (Ea). However, when these same cells were exposed to hypoxia in the presence of glibenclamide, there was a marked positive or depolarizing shift in membrane potential as shown in Cb, Db and Eb, respectively; note the cell Ca that was initially quiescent during hypoxia actually fired action potentials when hypoxia was combined with glibenclamide (Cb). The ‘n’ values for each type of response are shown on the right. C, control; Hox, hypoxia; W, wash; Glib, glibenclamide.
