
Figure 7. Immunofluorescence staining of neonatal rat AMC cultures for μ- and δ-opioid receptor expression.
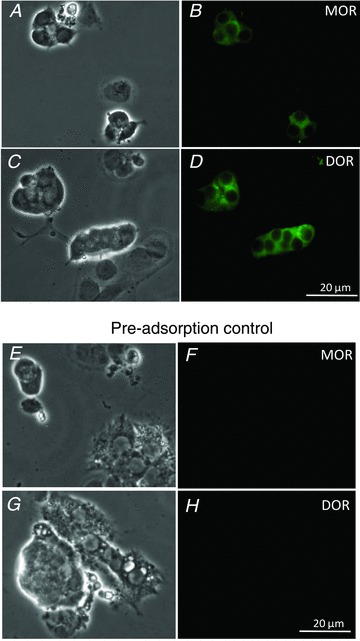
Corresponding phase and fluorescence (FITC) images of cultures showing positive immunostaining of AMCs for μ-opioid receptor (MOR) (A and B, respectively), and for δ-opioid receptor (DOR) (C and D, respectively). Pre-absorption controls with excess antigen (see Methods) confirming staining specificity for each antibody are shown in E–H. The data are representative of three independent experiments for each antibody staining.