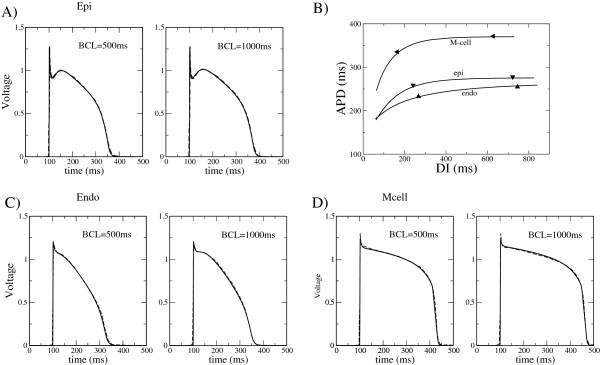
Figure 1.

AP morphologies calculated from the simplified model and compared to the experimental data by Li et al. [24] for different myocytes: A) epicardium, C) endocardium, D) mid-myocardium. Dashed lines represent the experimental data at two pacing rates, i.e., BCL=500 and 1000 ms. The APs obtained from the simplified model are represented by solid lines. B) Restitution curve APD(DI) for the parameters corresponding to different fits. The values by Li et al. are indicated by filled triangles.
