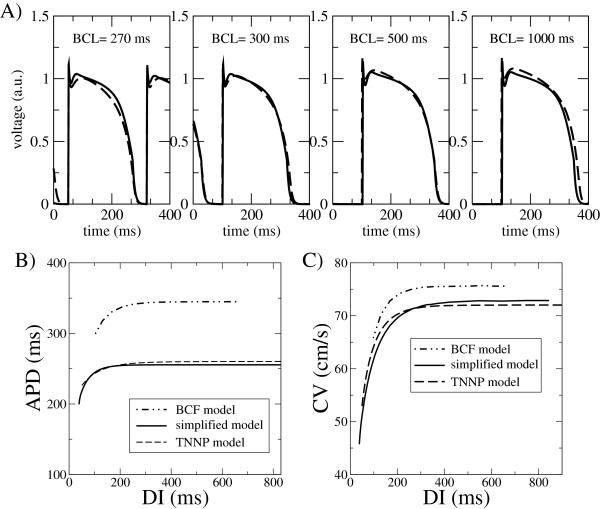
Figure 3.
Comparison of different models. A) APs morphologies from the simplified model (solid line) and those obtained from the simulation of the TNNP model (long dashed line). Four different pacing rates (BCL=270, 300, 500, 1000 ms) have been used for determining the parameter set of our model. Restitution curves B) APD(DI) and C) CV(DI) for our simplified model and the TNNP model. For completeness we also include the results of the 5 variable BCF model, with their parameter values for the fit to the TNNP model.

