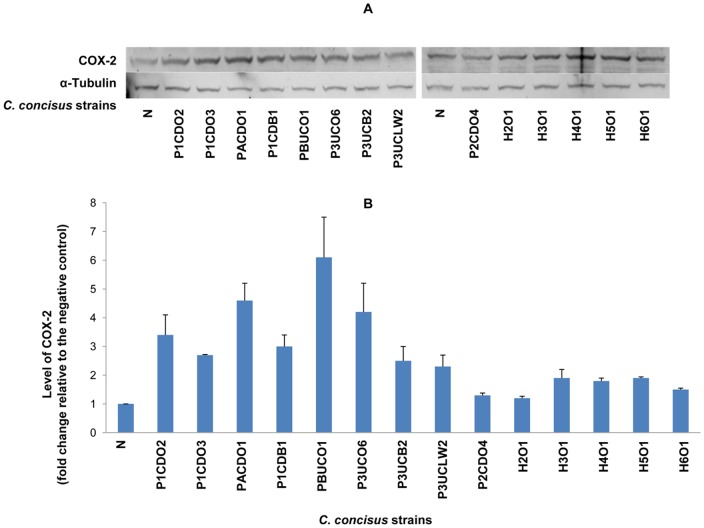
Figure 5. Detection of COX-2 by Western blot in HT-29 cells infected with C. concisus strains.
HT-cells 29 were lysed following incubation with C. concisus strains for 24 hours. Expression of COX-2 in HT-29 cells was detected by Western blot. The intensity of COX-2 band of each sample was normalized to the intensity of the internal control α-Tubulin of the same sample. The level of COX-2 was expressed as the fold change of the normalized band intensity of a sample relative to the normalized band intensity of the negative control (HT-29 cells without C. concisus infection). A: Representative Western blot of COX-2 (70 kD) and α-Tubulin (55 kD). B: Levels of COX-2 induced by different C. concisus strains; data were the average of triplicate experiments ± standard error. N: negative control. H2O1-H6O1: C. concisus strains isolated from healthy controls. The remaining nine C. concisus strains were from patients with IBD. The average level of COX-2 induced by C. concisus strains from patients with IBD was significantly higher than that induced by C. concisus strains from healthy controls (P<0.05).

