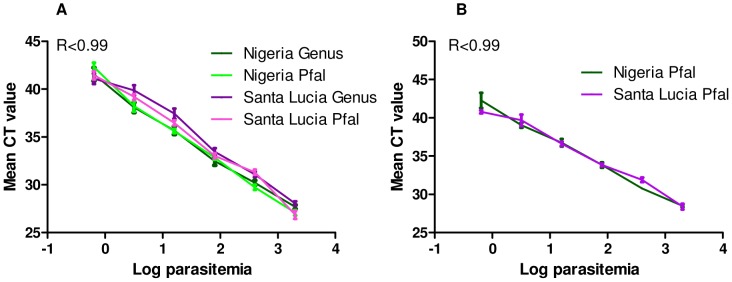
Figure 2. Quantitative comparison of PET-PCR assay and Rougemont real-time PCR assay.

The PET-PCR and Rougemont real-time PCR assays were run using two well-quantified P. falciparum strains (Nigeria and Santa Lucia) used at six differing parasitemia levels (2000, 400, 80, 16, 3.2 and 0.64 parasites/µl). To determine the correlation between CT values and parasitemia, the mean CT values obtained in the PET-PCR assay (A) and in the Rougemont real time PCR assay (B) were plotted against the log transformed parasitemia (Log parasitemia). The CT values demonstrated reproducible linearity over the parasitemia range tested as both methods show significant correlation with R2 values >0.990. No statistical difference in mean CT values was observed for the two different strains or for the two different methods (P>0.05).
