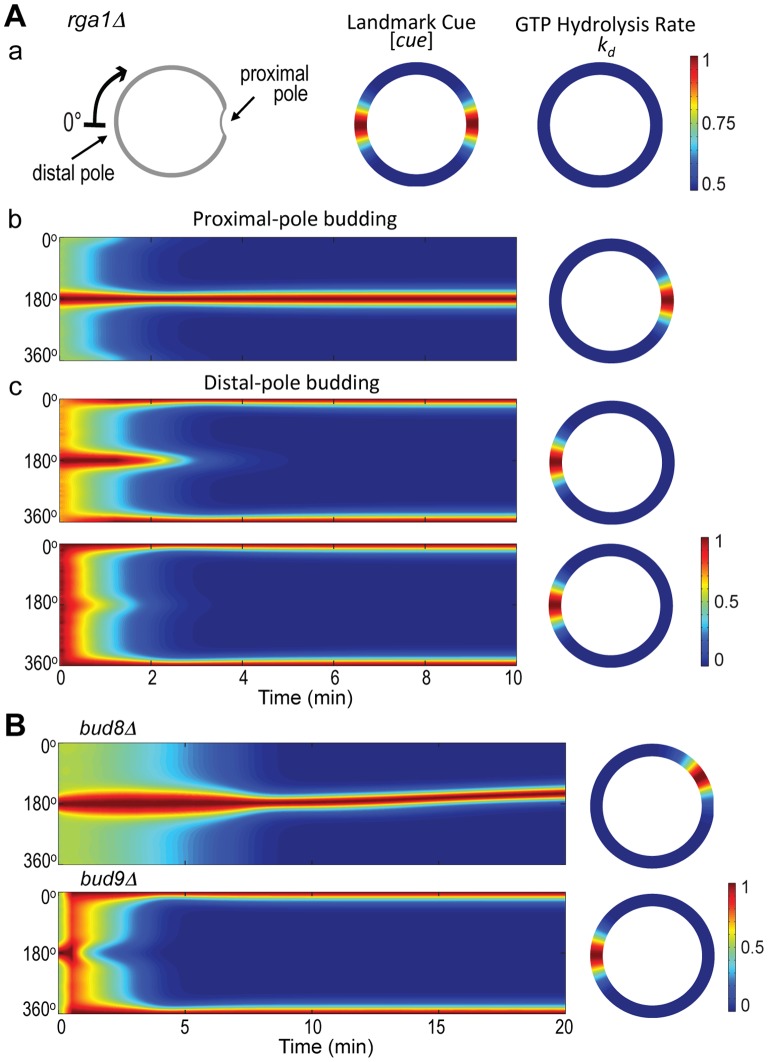
Figure 7. Mathematical modeling of Cdc42 polarization in diploid daughter cells deleted for RGA1, BUD8 or BUD9.
Aa. Coordinates are the same as in Fig. 2 (wild type) but the GTP hydrolysis rate of Cdc42 in the rga1Δ mutant is assumed to be about the same along the perimeter. See parameters in Table 2. Ab–Ac. Spatiotemporal dynamics of Cdc42-GTP leading to budding at (b) the proximal pole or (c) the distal pole in rga1Δ daughter cells. The horizontal axis represents the time window from 0 to 10 min. The 2D steady-state distribution of Cdc42-GTP is displayed on the right to each simulation. B. Spatiotemporal dynamics of Cdc42-GTP in diploid bud8Δ (top) and bud9Δ (bottom) mutants. The horizontal axis represents the time window from 0 to 20 min. The 2D steady-state distribution of Cdc42-GTP is displayed on the right to each simulation. Note: Cdc42-GTP became polarized at a site adjacent to the center of the proximal pole in bud8Δ (see 20 min time point), unlike in rga1Δ (see Fig. 7A, b).

