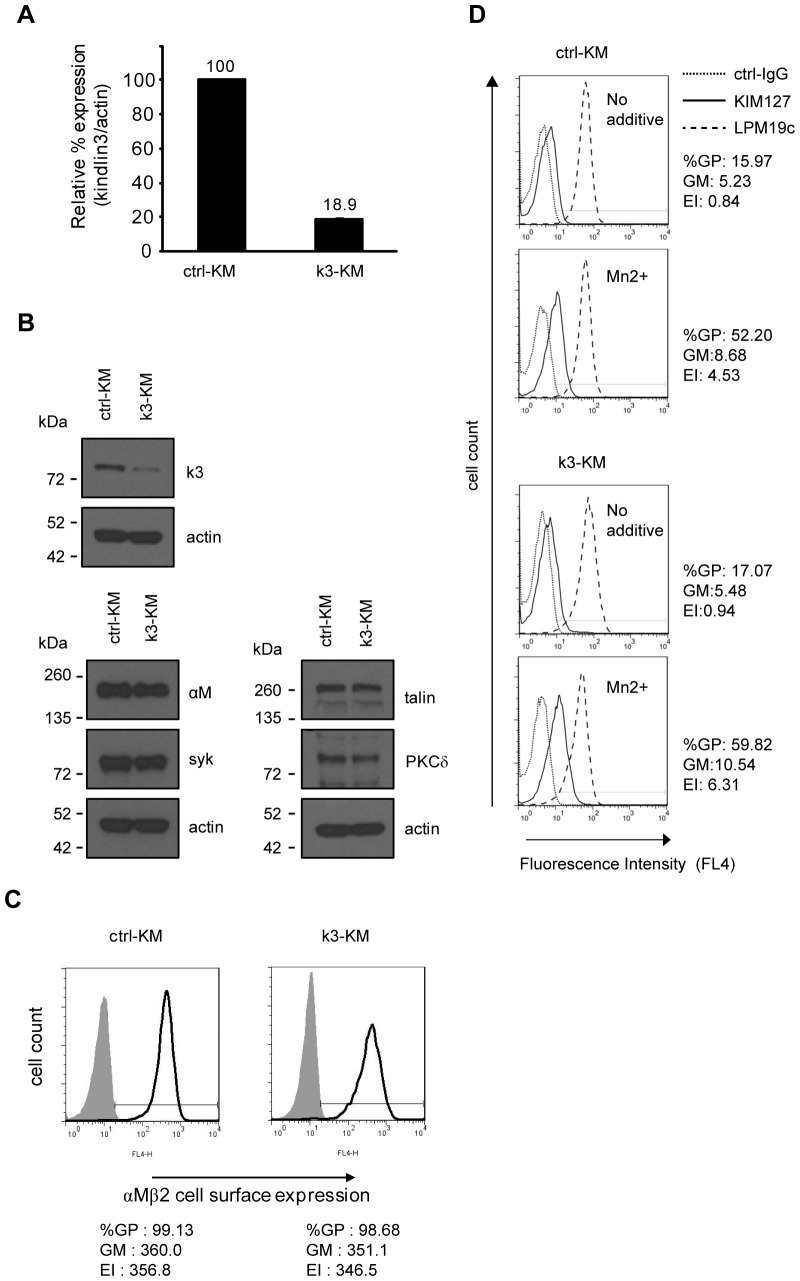
Figure 1. Knockdown of kindlin-3 expression in K562 cells expressing integrin αMβ2.
(A) qPCR analyses of kindlin-3 mRNA expression level in ctrl-KM and k3-KM cells. (B) Expression levels of kindlin-3 and other proteins in these cells were determined by immunoblotting. Actin was used as loading control. (C) Cell surface expression of integrin αMβ2 was determined by flow cytometry. Shaded and open histograms represent control IgG and mAb LPM19c stainings, respectively. GP: gated positive; GM: geo-mean; EI: expression index. (D) To determine extracellular activation of integrin αMβ2 on ctrl-KM and k3-KM cells. Cells were treated with Mn2+ (1 mM) or without and stained with mAb KIM127 at 37°C. Control IgG (ctrl-IgG) and mAb LPM19c were included for each condition. The %GP, GM and EI of mAb KIM127 staining are shown. One representative experiment out of two independent experiments is shown.

