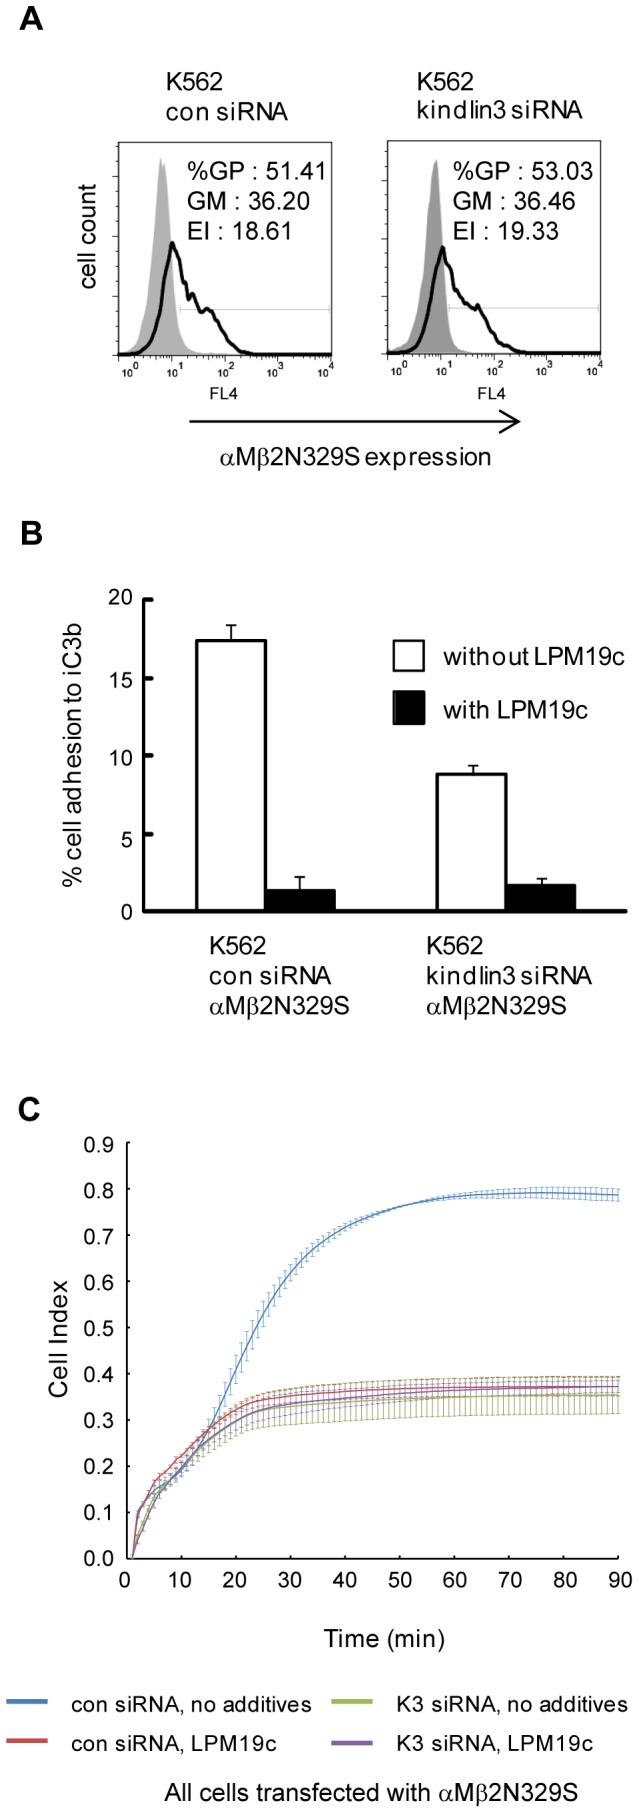
Figure 4. Kindlin-3 is involved in integrin αMβ2 outside-in signaling.

(A) Flow cytometry analyses of αMβ2N329S in cells transduced with control or kindlin-3-targeting siRNA. Shaded and open histograms represent control IgG and LPM19c stainings, respectively. GP: gated positive; GM: geo-mean; EI: expression index. (B) Cell adhesion assay on iC3b. (C) ECIS measurements on iC3b. In (B) and (C), each data point represents mean ± SD of technical triplicates. mAb LPM19c was used at 10 µg/ml. (A–C), a single representative experiment from three independent experiments is shown.
