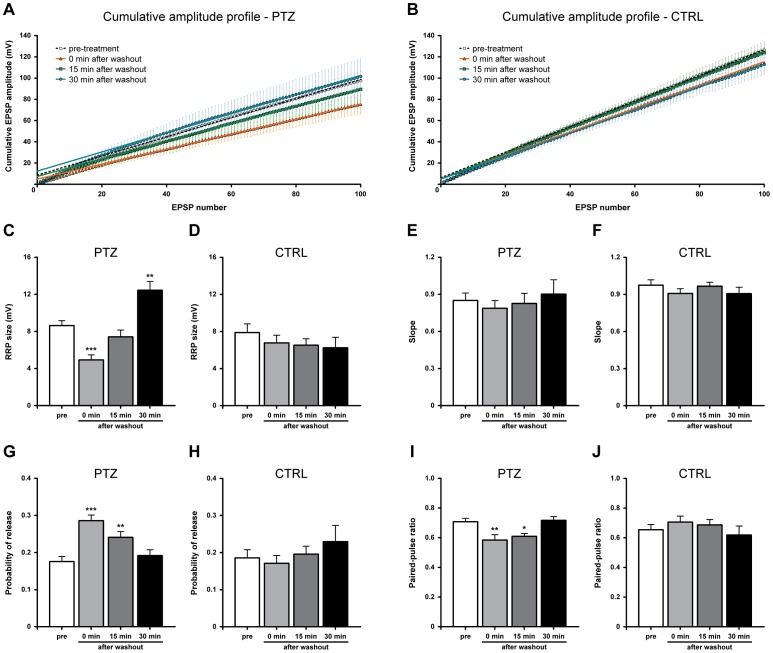
Figure 4. Epileptiform activity induces opposite changes in the RRP and Prel.
(A,B) Cumulative curves of EPSP amplitudes evoked at 10 Hz at different time-points. The linear part was fitted as described in Methods. (C) Following PTZ exposure, the estimated RRP size, expressed in mV, significantly decreased soon after washout, recovered at 15 minutes and then increased 30 minutes post-treatment. (D) On the contrary, the RRP remained unchanged in control group. (E,F) Bar graph of mean values of slopes measured from the linear regression lines, indicating similar vesicle replenishment rates in both treated and untreated synapses. (G) Bar graph of Prel showing an increase in this parameter following epileptiform activity which returns to pre-treatment values at 30 minutes after drug washout. (H) No alteration was measured in untreated synapses. (I) Histogram of mean PPR values obtained from treated B2–B2 synapses. PTZ exposure transiently reduced PPR with a complete recovery at 30 minutes after washout. (J) No detectable changes in PPR were observed in control group.

