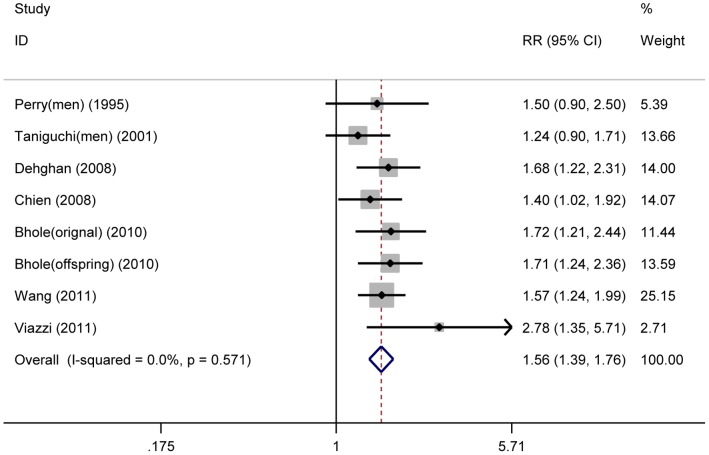
Figure 2. Serum uric acid and risk of incident type 2 diabetes.
Fix-effects model analysis for the overall RR (1.56, 95% CI = 1.39–1.76) of incident type 2 diabetes for the highest compared with the lowest category of serum uric acid level. No evidence of heterogeneity across studies was found (I2 = 0.0%, P = 0.571). The square sizes are proportional to the weight of each study in the meta-analysis; the horizontal lines represent 95% CIs; the diamond represents the overall RR with its 95% CI.

