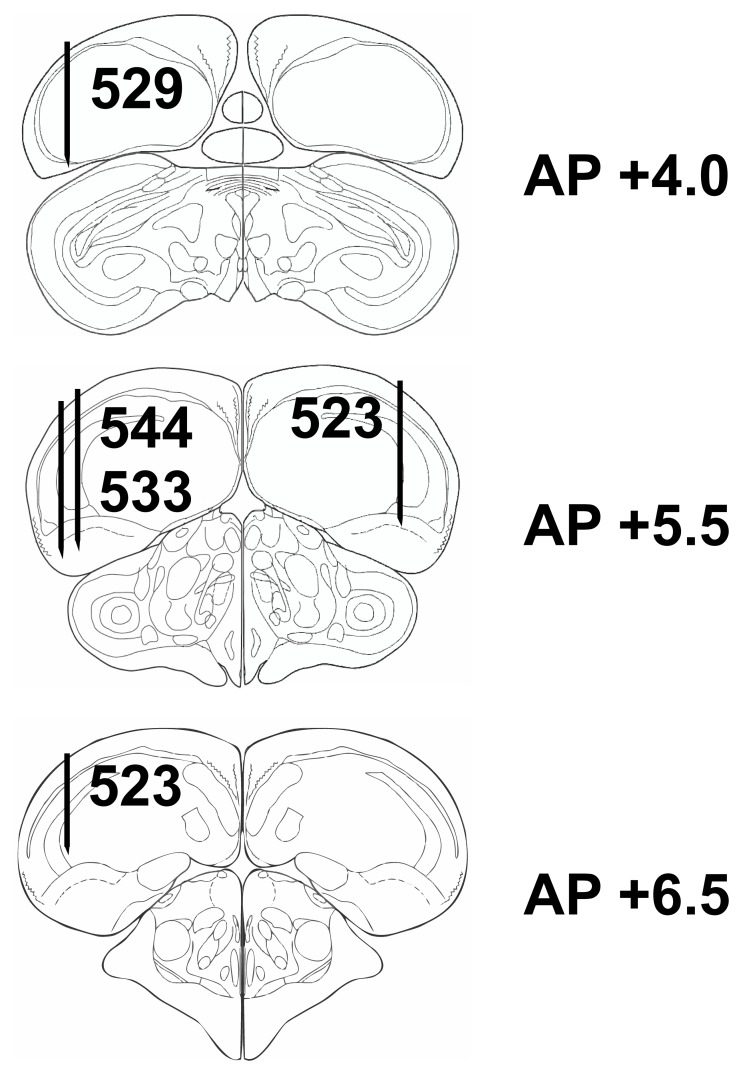
Figure 9. Histological reconstruction of the electrode tracks for four pigeons.
Schematic sagittal sections of the pigeon brain, modified after the pigeon brain atlas of (Karten and Hodos, 2008). Black lines represent electrode tracks. Numbers next to electrode tracks identify individual animals. All tracks were within the boundaries of the NCL as defined in [8].

