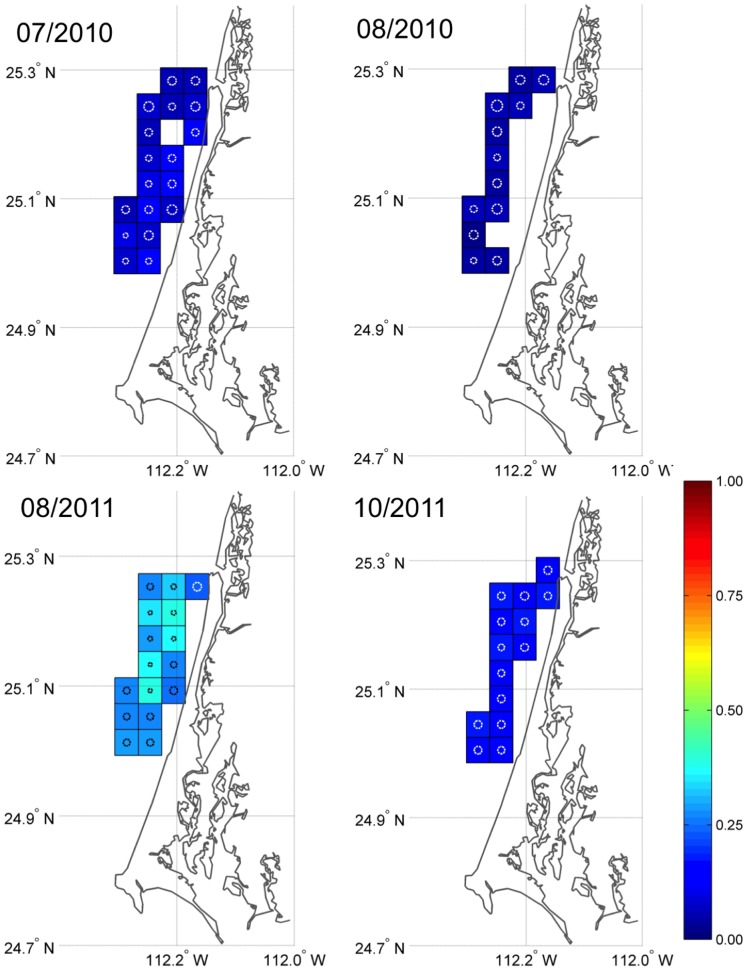
Figure 3. Estimated stranding probabilities for four drifter trials at the main fishing area in Playa San Lázaro (PSL) during 2010 and 2011.
Estimates and their 95% posterior intervals are listed in Table 1. All deployment quadrats are 0.04×0.04 degrees. Circles in the quadrats are coefficient of variations (CV); a circle almost filling the quadrat corresponds to a CV of 1.0). The colored scale shows the stranding probability (p) indicating how likely oranges are to strand when deployed at different locations at sea.

