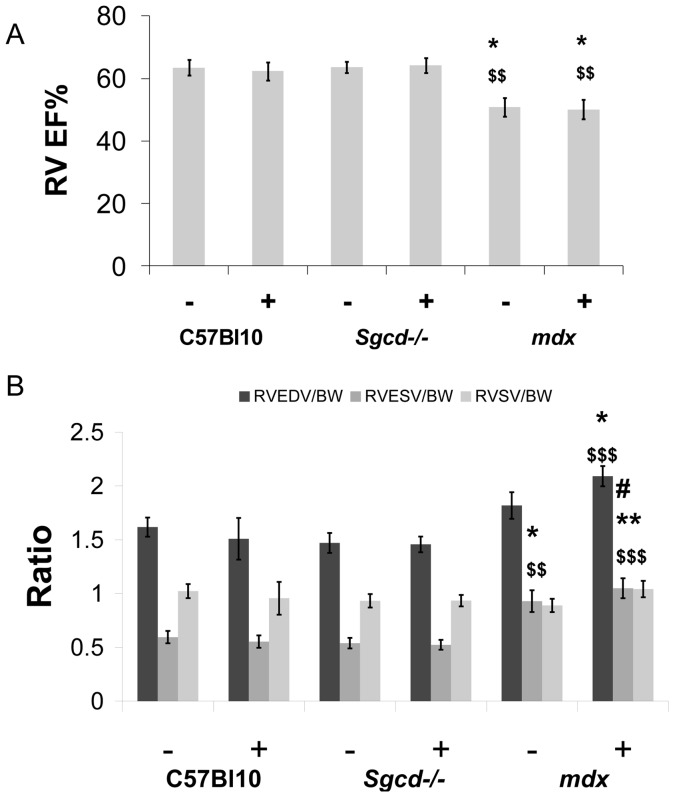
Figure 4. Deterioration in right ventricular function with metoprolol in mdx mice.
Right ventricular ejection fraction (RV EF, panel A), and right ventricular volume data (with abbreviations as for LV in figure 2, panel B). (*Different from C57 Bl10 control, $different from Sgcd-/- control, #different from metoprolol-treated C57 Bl10, number of symbols denotes level of significance e.g. *p<0.05, **p<0.01, ***p<0.001); (BW = body weight, – sign indicates without metoprolol and + indicates with).

