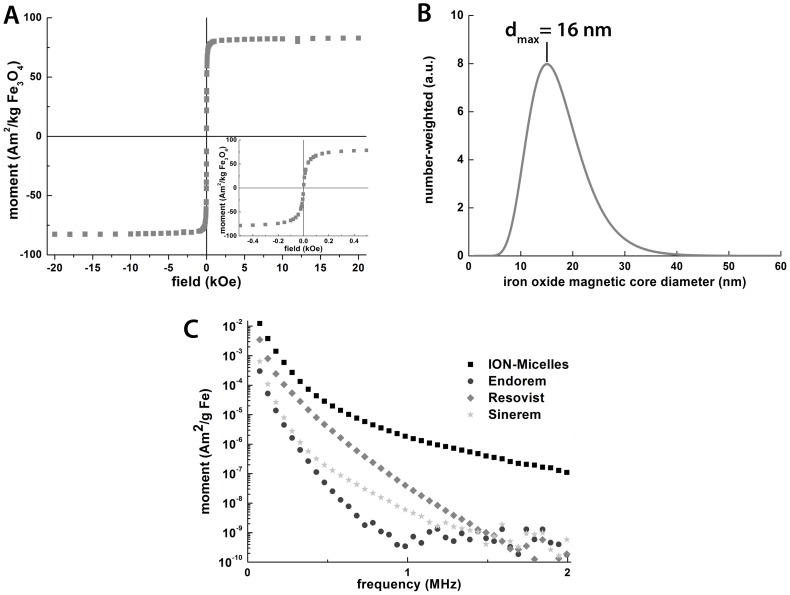
Figure 5. Analysis of ION-Micelles magnetic properties.
(A) Magnetization curve of the ION-Micelles at room temperature. Inset: zoomed-in view around zero field. (B) Number-weighted particle size distribution of the ION-Micelles calculated from the magnetization curve. dmax is the diameter corresponding to the maximum of the peak. (C) MPS experimental data of the ION-Micelles, Endorem, Resovist and Sinerem plotted as magnetic moment (normalized for iron content) versus frequency.

