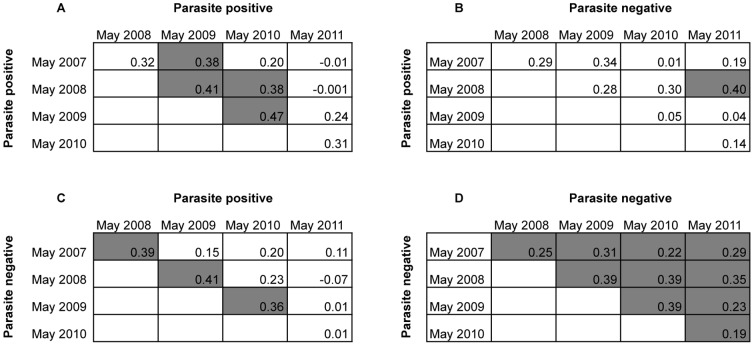
Figure 2. Comparison between ML ratios measured at different cross-sectional surveys.
Spearman rank correlation coefficient is used to assess the relationship between ML ratios across different surveys according to parasite positive/negative status at the time the ML ratio was measured. Results are shown for children that were parasite positive at the May 2007 or 2008 or 2009 or 2010 survey and parasite positive (A) or parasite negative (B) in subsequent surveys (that is 2008–2011). In (C) and (D) results are shown for children that were parasite negative at the May 2007 or 2008 or 2009 or 2010 survey and parasite positive (C) or parasite negative (D) in subsequent surveys (that is 2008–2011). Rho values from all comparisons are shown and statistically significant comparisons (P<0.05) indicated in shaded boxes. Unshaded boxes represent comparisons that showed no significant correlation.

