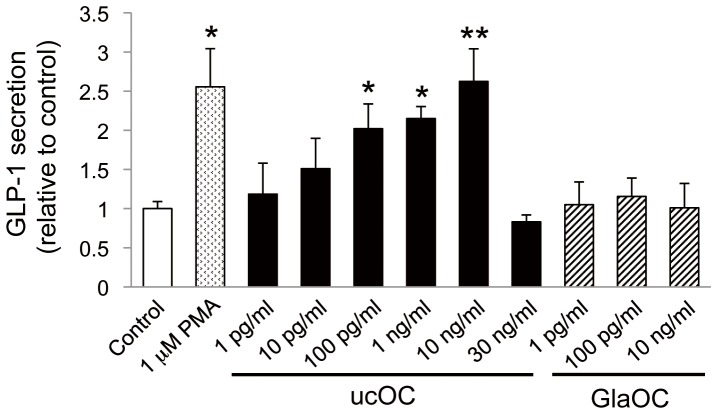
Figure 2. OC-induced GLP-1 secretion in STC-1 cells.
STC-1 cells were incubated for 60 min with vehicle (control) or the indicated concentrations of ucOC, GlaOC, or PMA. Data are expressed relative to the control value (33.1 pg per 1 × 10⁵ cells) and are means ± SEM from four to eight independent experiments. *P < 0.05, **P < 0.01 versus control (Student's t test).

