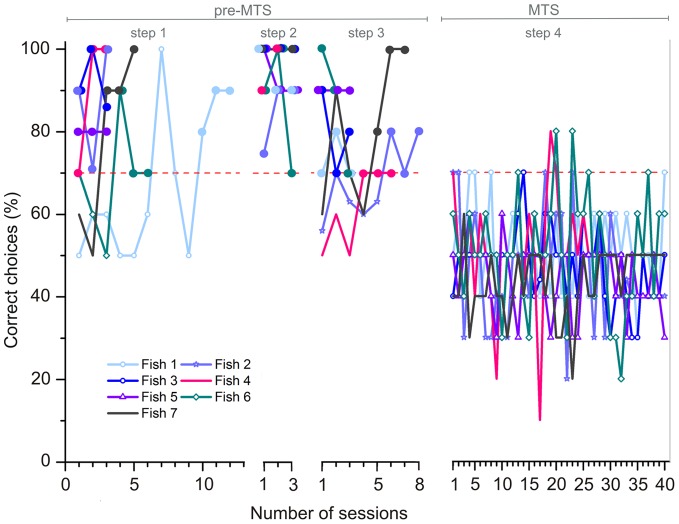
Figure 9. Training achievements for all individuals used in parts 1–4 of experiment 1b.
The colored lines display the individual learning success for each fish, shown as the percentage of correct choices per session (à 10 trials) during pre-MTS-phase and MTS-phase. The dashed red line indicates the threshold for the learning criterion at 70 % correct choices. The three sessions necessary to reach criterion (≥70 % correct choices) are highlighted by big dots colored analogous to the individual learning curves. If two or more dots fall together at one session, they are shown overlapping each other.

