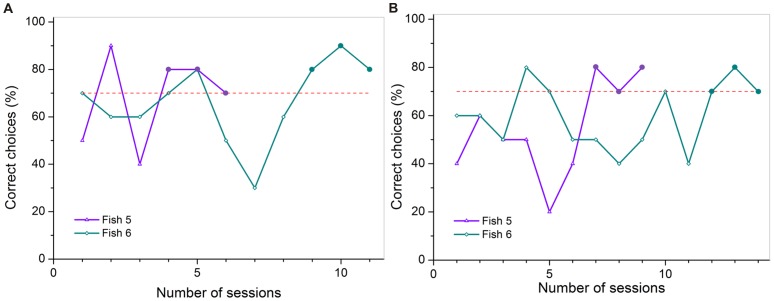
Figure 11. Training achievements for all individuals used in part A and B of experiment 2b.
The colored lines display the individual learning success for each fish that reached criterion, shown by the percentage of correct choices per session (à 10 trials). The dashed red line indicates the threshold for the learning criterion at 70 % correct choices. The three sessions necessary to reach criterion (≥70 % correct choices) are highlighted by big dots colored analogous to the individual learning curves.

