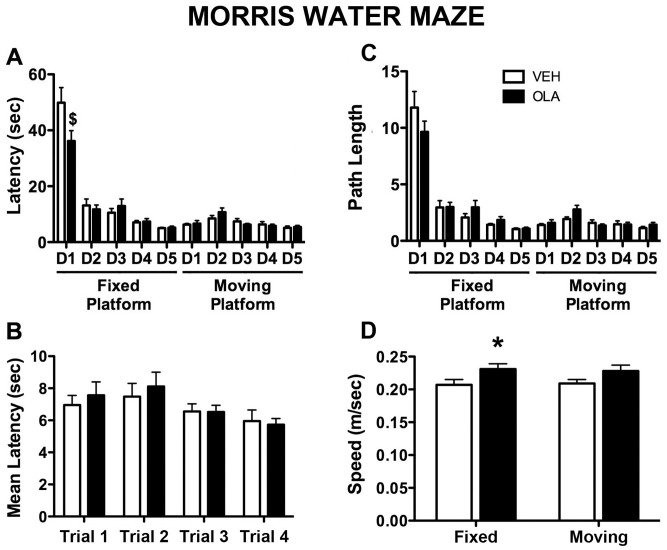
Figure 3. Morris water maze performance.
A. Latency to find the hidden platform on each day of testing; the measure used is the average latency in the 4 trials on that day. D1–D5 indicate days 1–5 of either the fixed- or moving platform versions of the MWM test. OLA treatment significantly altered MWM performance on the first day of testing only ($). B) Latency to find the hidden platform as a function of trial number, averaged across all 5 days of “moving platform” testing. There was no significant effect of OLA treatment on any trial. C. Path length during the search for the hidden platform on each day of testing; the measure used is the average path length in the 4 trials on that day. D. Mean swim speed averaged across trials and days of testing for each rat, with data from the fixed- and moving platform versions of the MWM analyzed separately. Error bars are standard error of the mean. * indicates p = 0.05.

