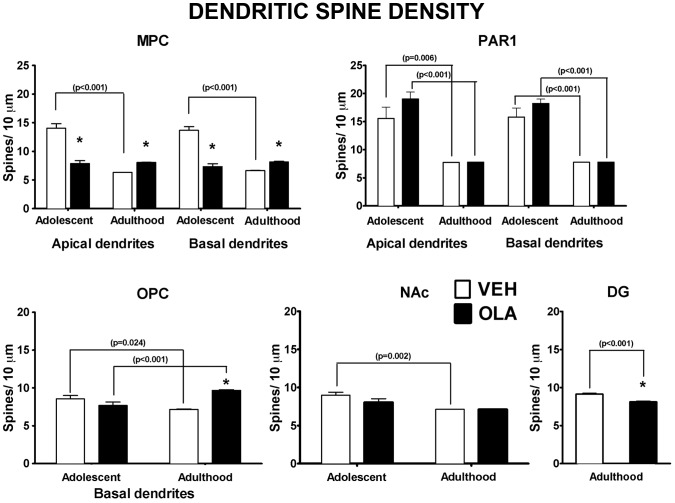
Figure 6. Dendritic spine density.
* indicates statistically significant difference (p = 0.024 to <0.001) between VEH- and OLA-treated rats at the same age. p-values above brackets indicate the significance of age-related changes in similarly treated rats. All p-values are based on paired t-tests corrected for multiple comparisons. Error bars are standard error of the mean.

