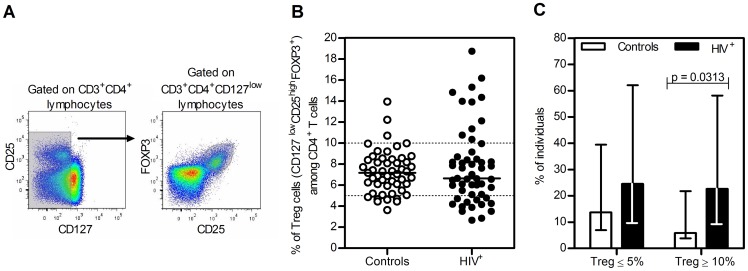
Figure 1. High variability of Tregs percentages in HIV+ individuals.
A. Representative dot plots from an HIV+ individual illustrating the gating strategy for Tregs analysis. Lymphocytes (selected according to FSC and SSC) were gated on CD3+CD4+ cells, on low or no expression of CD127 and on the expression of FOXP3 and high levels of CD25. B. Tregs percentages amongst CD4+ T cells in control and HIV+ individuals. Each dot represents a single individual and the lines the median Tregs percentages within CD4+ T cells. Dashed lines represent the range of Tregs percentages among total CD4+ T cells described for healthy individuals (between 5% and 10%) [51]. C. Percentage of individuals with Tregs ≤5% and ≥10% in controls and HIV+ individuals. P-value for the comparison of these proportions (Chi-square test) and the 95% confidence interval are depicted.

