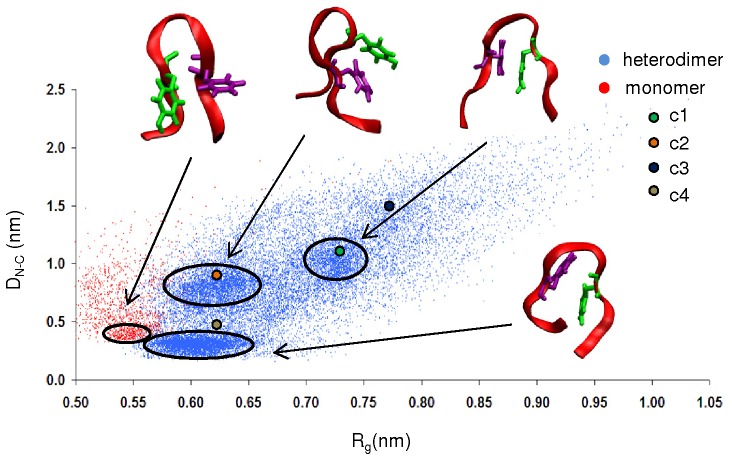
Figure 5. ApoC-II(60–70) structural characteristics in free and cyc(60–70) bound states.
End-to-end distance with respect to the radius of gyration of apoC-II(60–70) peptide in its monomeric state (red data points 10]) and as a heterodimer bound to cyc(60–70) (blue data points). Ribbon representations of the peptides corresponding to the indicated regions of sampled conformational space are shown as insets. The positions of the cluster representative structures are illustrated with coloured circles: c1 (green), c2 (orange), c3 (dark blue) and c4 (tan).

