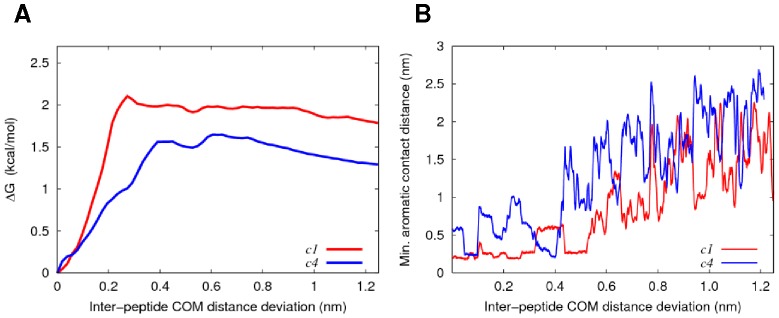
Figure 7. PMF and inter-peptide COM distance profiles from umbrella sampling simulations.

(A) PMF profiles for the dissociation of apoC-II(60–70) peptide from the hydrophobic (red) and hydrophilic (blue) face of cyc(60–70). (B) Minimum contact distance between the aromatics as a function of centre-of-mass separation for apoC-II(60–70) and cyc(60–70). For clarity, the moving average for each profile is shown in red and blue, respectfully.
