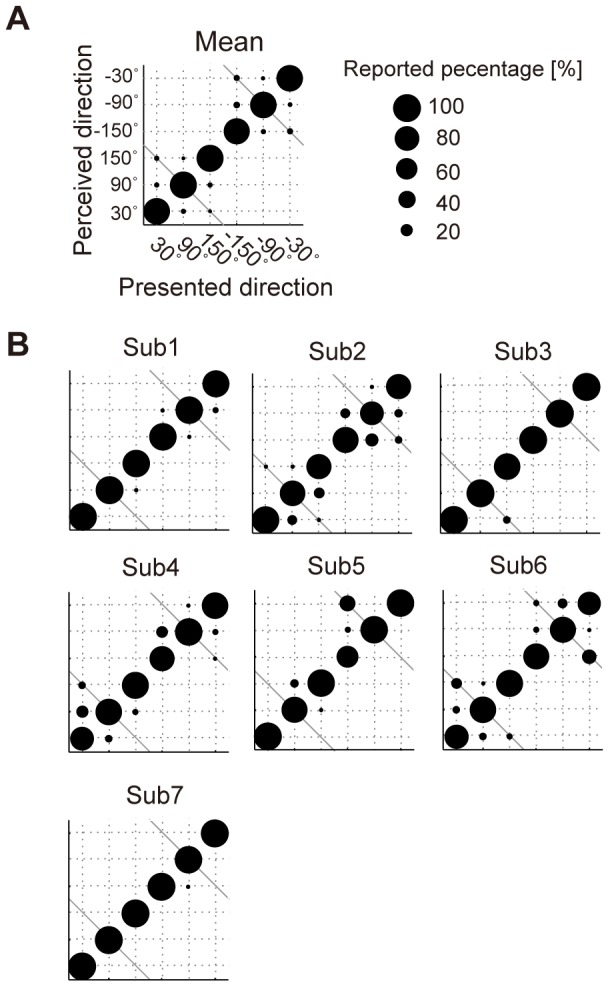
Figure 3. Accuracy in localization test.

(A) Localization accuracy across subjects for each direction. Each circle represents the percentage the subjects reported accurately as the perceived direction. The horizontal axis represents the direction of presented auditory stimulus and the vertical axis denotes the direction the subjects perceived. Two diagonal gray lines at lower left and upper right indicate the direction of front-back confusion. (B) Localization accuracy for each subject.
