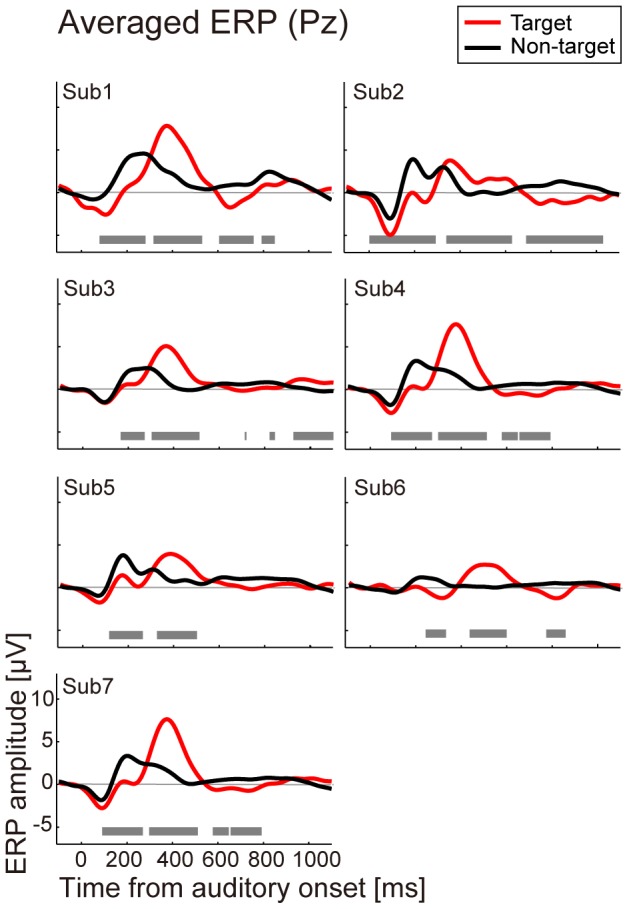
Figure 4. Averaged ERP at Pz for each subject.

Each figure shows the averaged ERP responses at electrode Pz for each subject (Sub1–Sub7). The horizontal axis denotes time from auditory onset, and the vertical axis shows the ERP amplitude. The red line shows the ERP for target trials and the black line shows the ERP for non-target trials. The gray bar at the bottom of each figure indicates the significant difference between target and non-target waveforms (Mann-Whitney U test, p<0.01).
