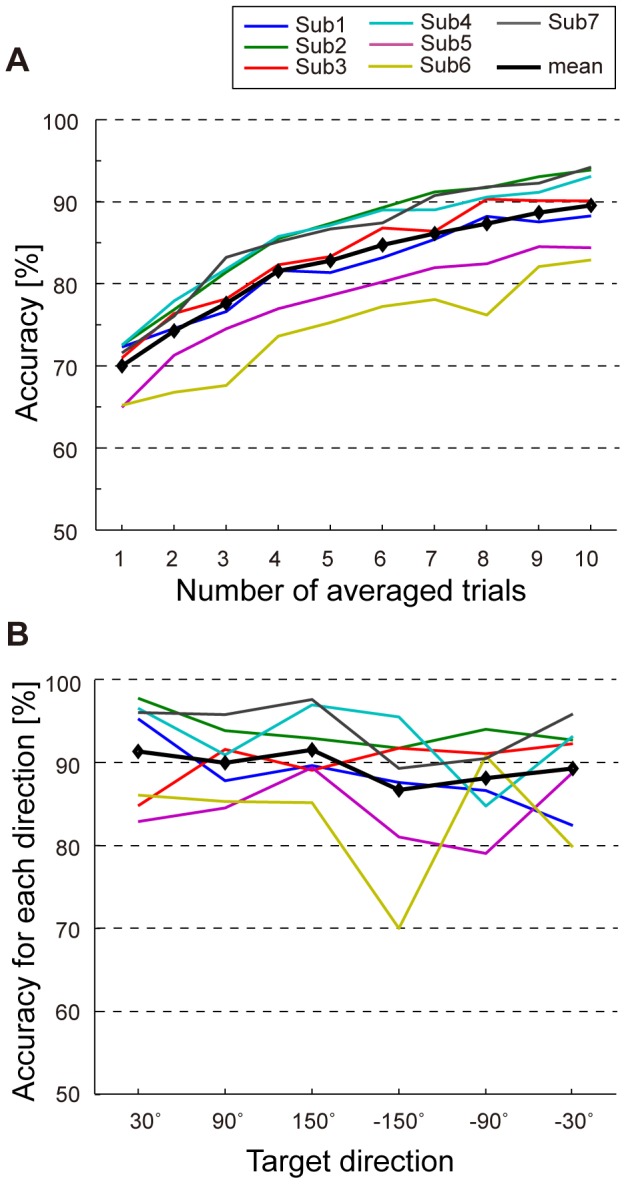
Figure 6. Accuracy in predicting the perceived direction and its directional biases.

(A) Classification accuracy when the number of averaged trials was different. Each colored line represents the accuracy for an individual subject. The bold black line indicates the mean accuracy across subjects. (B) Classification accuracies for each direction. The data for 10-averaged trials is shown. Each line shows averaged accuracy across subjects for each direction and average for all the directions.
