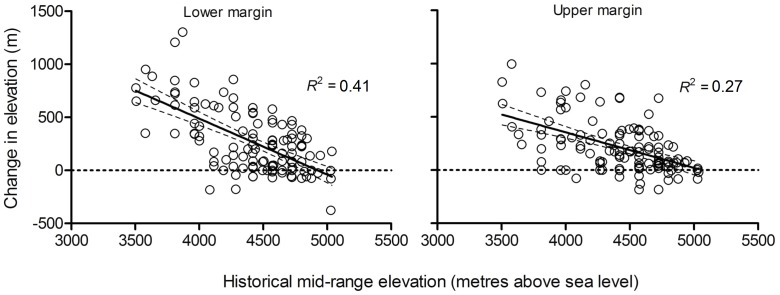
Figure 2. Change in the elevational range margins for endemic plant species during the last century.
Change in elevation of the lower (left panel) and upper (right panel) range margins for 124 endemic plant species between historical (1850–1909) and recent (2007–2010) periods. The dashed horizontal line represents zero net shift. A linear regression line (and 95% confidence intervals) is also shown for each subplot.

