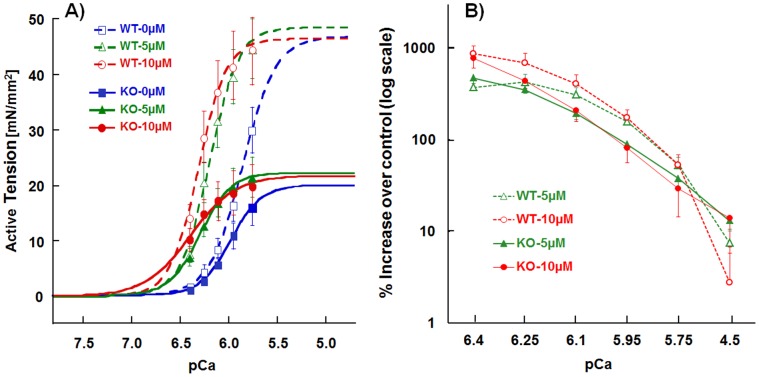
Figure 3. Tension–pCa relations in WT and NEB KO skinned TC muscle fibers.
A) Average active tension-pCa curves in WT (open symbols, dashed) and KO (closed symbols, solid) mice with 0 (blue), 5 µM (green) and 10 µM (red) CK-2066260 at SL = 2.1 µm. Curves in CK were shifted to the left in both WT and KO, i.e. calcium sensitivity is increased. Note that at pCa>6.0, CK-2066260 increased active tension of NEB-KO muscle beyond that of WT. B) Relative active tension increase (plotted on a log scale) in 5 and 10 µM of CK over 0 µM of CK at various pCa levels. Regardless of genotype, active tensions were significantly increased from ∼800% at the pCa 6.4 to ∼10% at pCa 4.5. Results from five WT and five KO mice.

