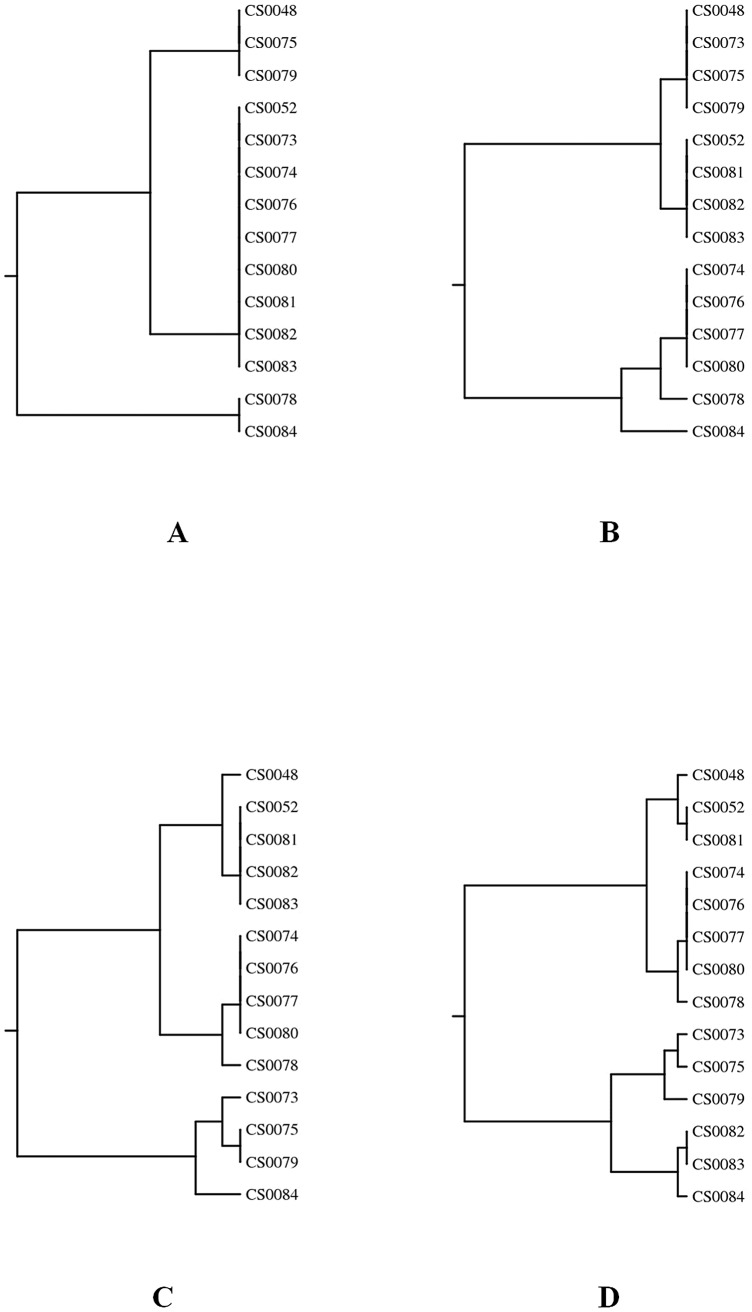
Figure 1. Dendograms based on restriction profiles of .
14 C. jejuni isolates were digested using Sau3AI (A), AluI (B), a combination of Sau3AI and AluI (C), and DdeI (D). flaA-RFLP cluster analysis was performed with the Dice correlation coefficient and the unweighted pair group mathematical average clustering algorithm of BioNumerics ver. 4.50.

