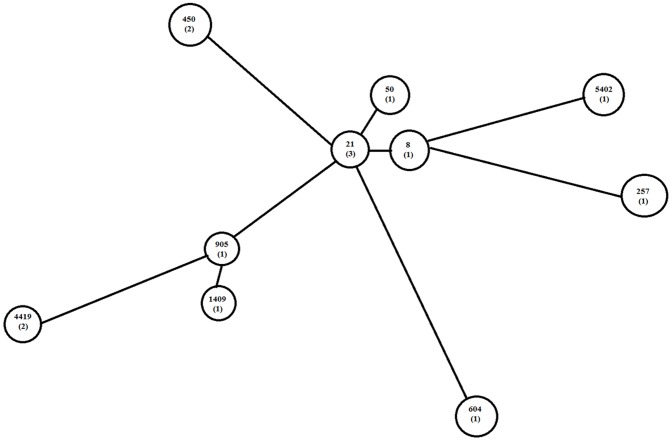
Figure 4. Minimum spanning tree depicting the clustering of 10 STs identified among 14 C. jejuni isolates.
The tree was created using BioNumerics (version 4.6; Applied Maths). Each ST is represented by a circle. Numbers in brackets expressed numbers of isolates within a ST. The ST designations were obtained from http://pubmlst.org/campylobacter.

