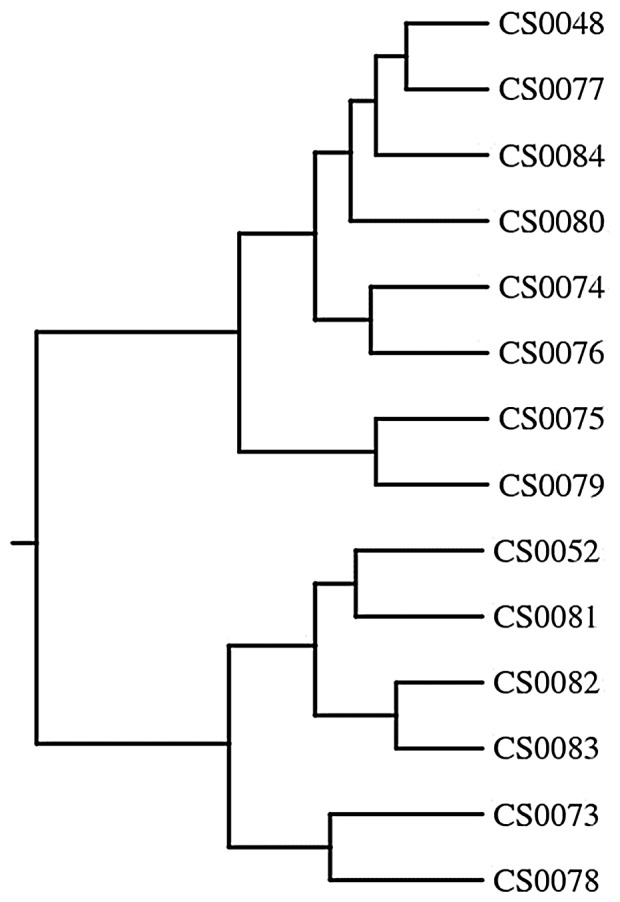
Figure 6. Dendrogram based on microarray data using DendroUPGMA.

The clustering of C. jejuni isolates represents 14 different clusters based on the binary microarray data using the simple matching distance metric and (UPGMA) using average linkages.

The clustering of C. jejuni isolates represents 14 different clusters based on the binary microarray data using the simple matching distance metric and (UPGMA) using average linkages.