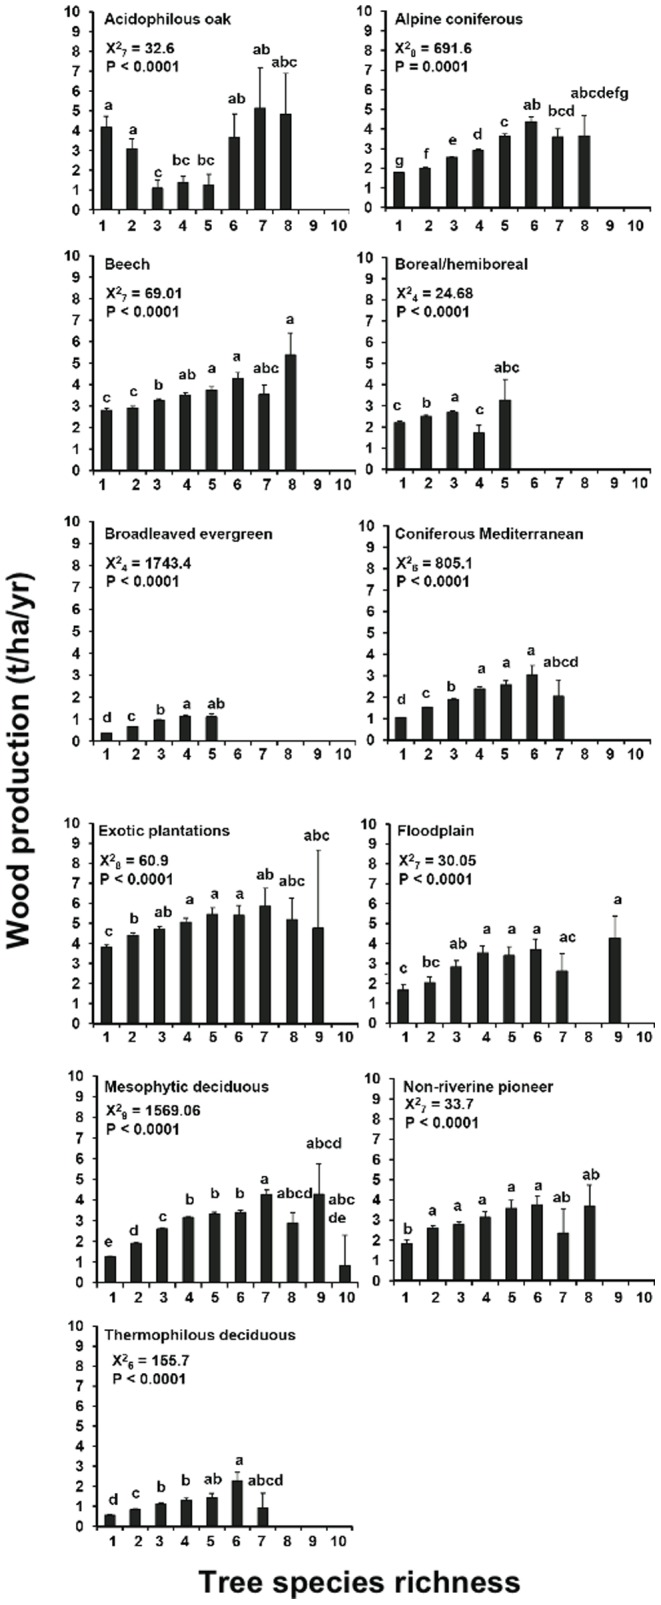
Figure 3. Tree wood production with increasing tree species richness.

Values indicate LS means (±SE). Different letters above columns indicate significant differences between stands with different species richness according to GENMOD-procedure in SAS. n.s. = not significant.
