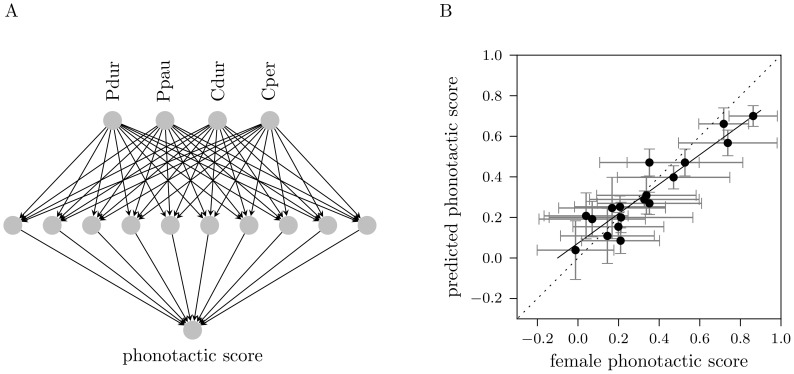
Figure 2. Network diagram and predictive performance of the best 4-feature model.
(A) The network diagram consists of four input neurons representing temporal calling song features, which project to input-evaluating neurons in the hidden layer. These in turn project to the output neuron mimicking the relative phonotactic score; abbreviations: Pdur - pulse duration, Ppau - pulse pause, Cdur - chirp duration, Cper - chirp period. (B) Correlation between the phonotactic score of 18 test samples predicted by the best 4-feature model and the experimentally measured scores. Each dot shows the mean phonotactic score for a given song pattern that was presented to on average 31 females and tested for 100 times with the model. The errorbars indicate standard deviation across individual females (horizontal) and across 100 repeated model simulations (vertical). The solid regression line has a slope of 0.73. The performance:  and
and  .
.

