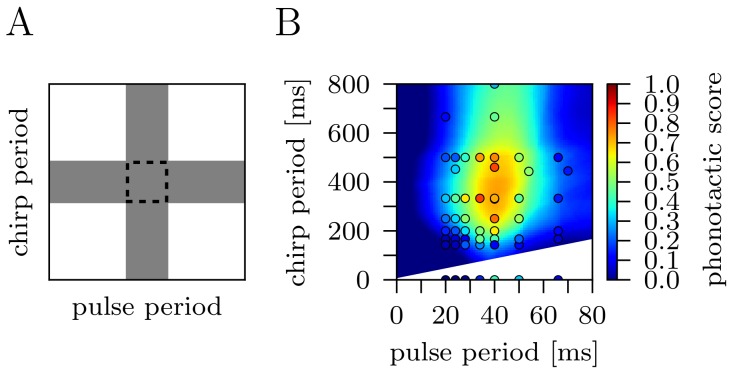
Figure 3. Interaction of the short and long time scale.
(A) Sketch of a logical AND-operation (central square) and an OR-operation (gray shading). (B) Chirp period - pulse period response field predicted by the best 4-feature model (pulse duration, pulse pause, chirp duration, chirp period). The dominant circular area of highest response values suggests an AND-operation. Circles indicate experimentally measured phonotactic scores.

