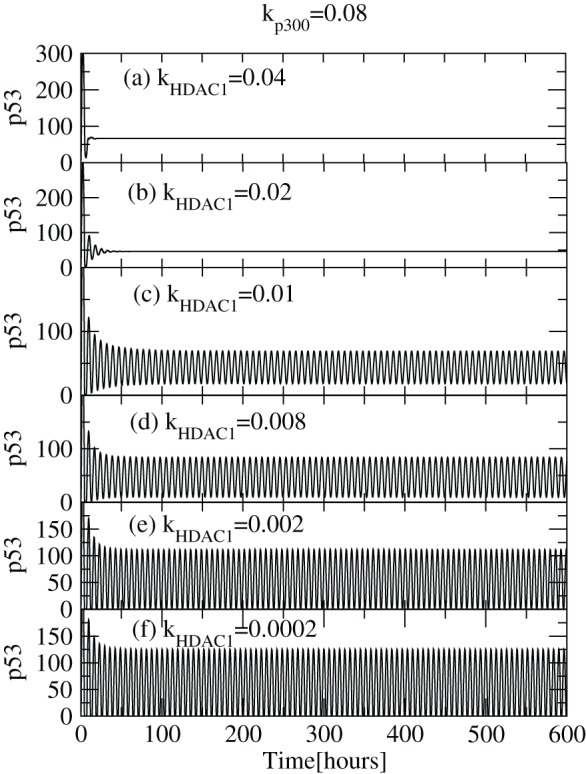
Figure 5. Activation of  via variation of
  level.

Plots of  concentration levels as a function of time in hours for various
  values 0.0002, 0.002, 0.008, 0.01, 0.02 and 0.04 respectively (at constant value of
  ), showing activation and stabilization of
  .
.
