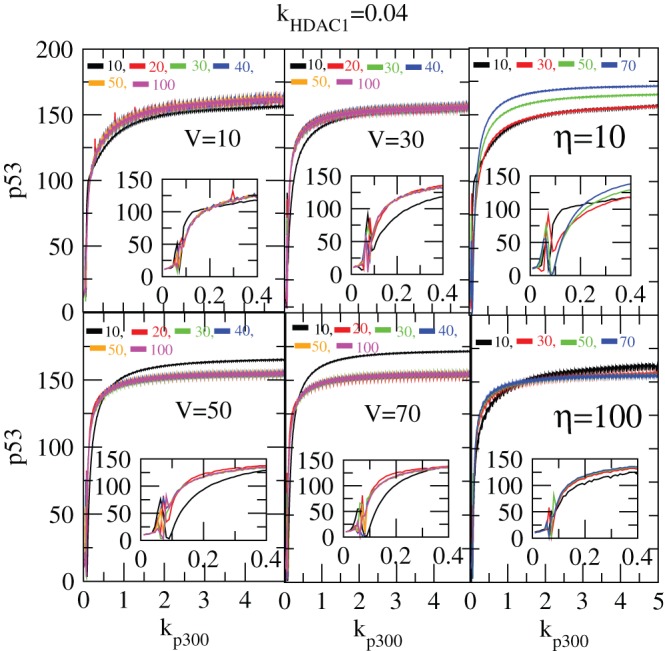
Figure 17. Stabilization of  in stochastic system.

(a) Plots of  concentration levels as a function of
  for different values of system size, V = 10, 30, 50 and 70 and for different values of
  = [10–100] as shown in the four left panels. The insets show the enlarged portions of the activated regimes in each case. (b) Plots of
  level versus
  for different V = 10, 30, 50, 70 and for two different values of
  = 10 and 100 respectively as shown in two right hand panels.
