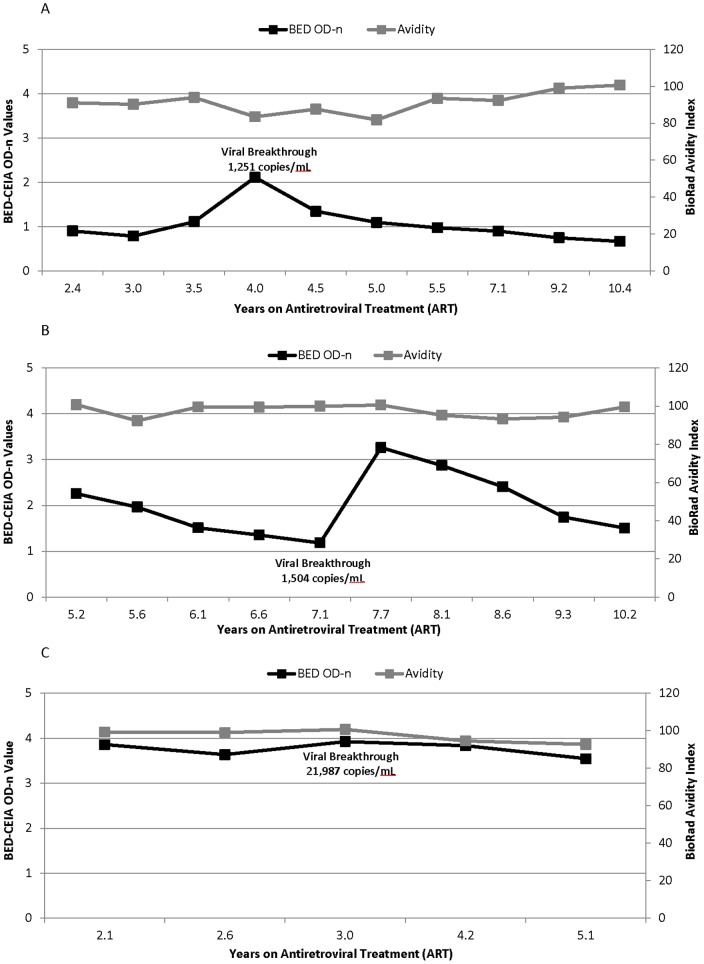
Figure 3. The effect viral breakthrough on BED-CEIA and avidity results.
20 virally-suppressed patients (179 samples) who had evidence of viral breakthrough while receiving ART (>400 copies/ml) with subsequent viral suppression. (A) Individual example of BED-CEIA OD-n values increase with viral breakthrough. Apart for time point listed, all other time points had viral loads <400 copies/ml. (B) Example of the increase in BED-CEIA OD-n values after viral breakthrough time point; results from one patient. Apart for time point listed, all other time points had viral loads <400 copies/ml. (C) Example of BED-CEIA OD-n values that showed no change with viral breakthrough. Apart for time point listed, all other time points have viral loads <400 copies/ml.

