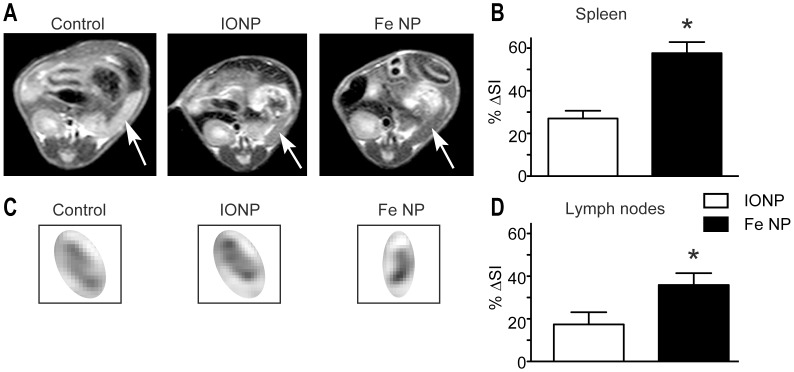
Figure 1. MRI contrast in the spleen and inguinal lymph nodes following administration of Fe NP or IONP.
(A) Example images showing the change of signal intensity (SI) in the spleen (arrows), and (C) inguinal lymph nodes 8 h after receiving intravenous PBS (control, left), IONP (middle) or Fe NP (right). (B) The SI in the spleens and (D) lymph nodes were compared those of control mice and plotted as %ΔSI signal as follows: (SI of control - SI of subject)/(SI of control). (*P<0.05 by Mann-Whitney rank-sum test).

